Drunk Driving
Analysis done by our team on the road accidents took place between 2019-2022 in UK region
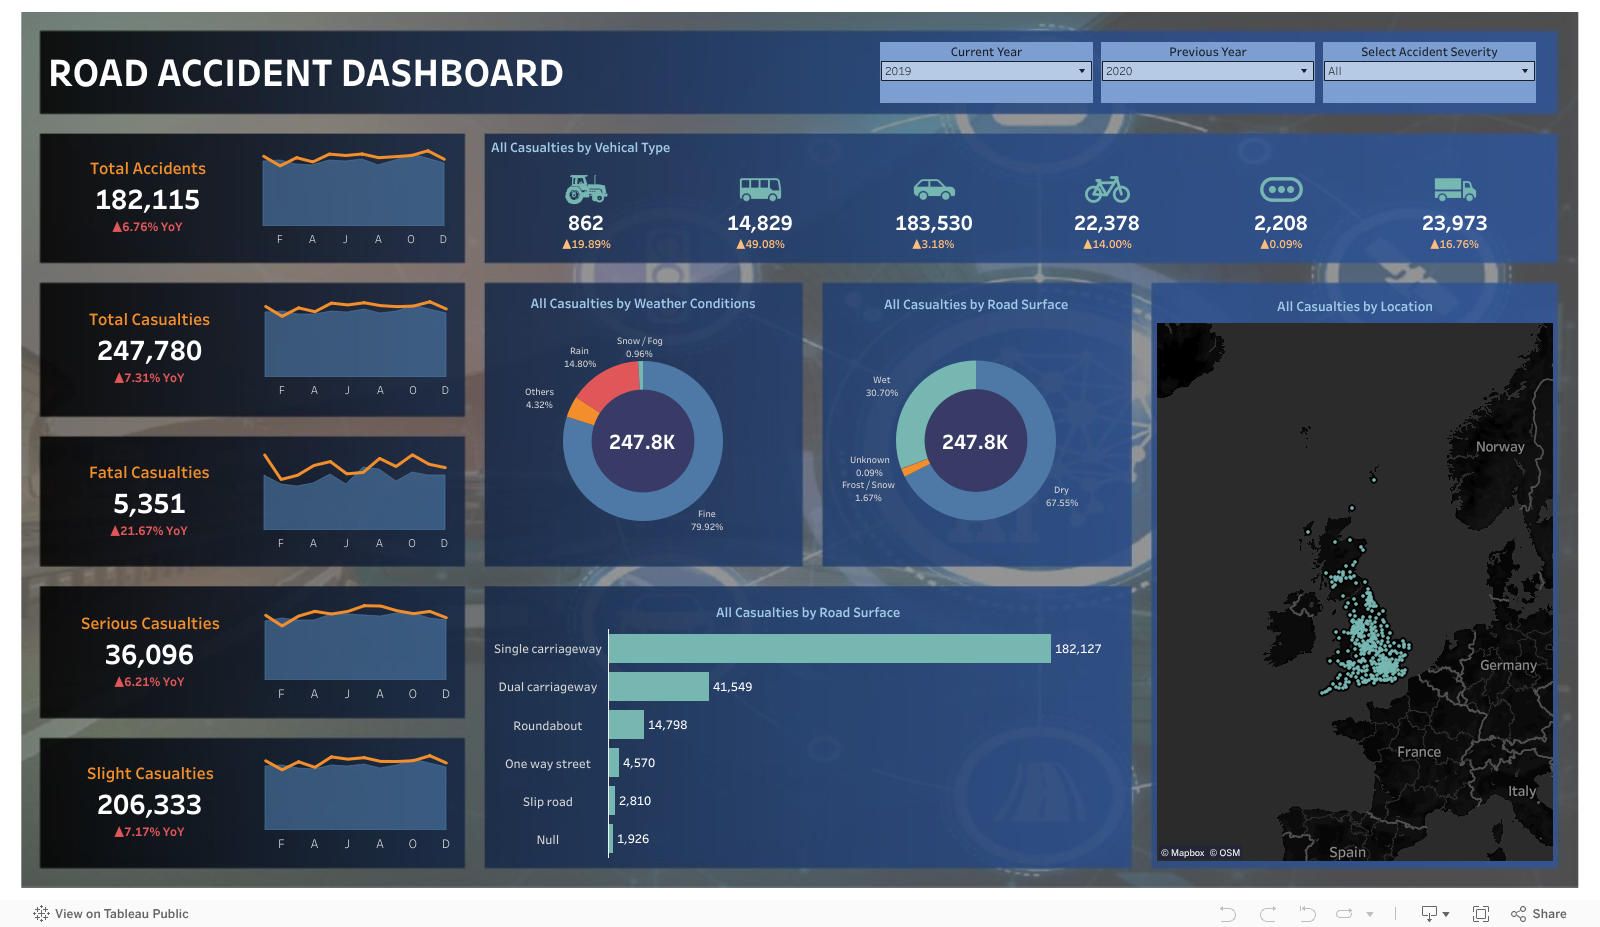
The dashboard presenting all the analysis and information about the Road Accidents that took place between the year 2019-2022 in United Kingdom region.
Based on our analysis, some important findings from our result are
Total Accidents between the year 2019-2022
Total Casualities between the year 2019-2022
Fatal Casualities between the year 2019-2022
The stories that will tell you about the data that we used and about our findings in more deapth.
The map to showcasing all the Accidents and Casualities that occured in different cities of United Kingdom over the time period.
VIEWThe graph showcasing the Casualities sparkline that happened in the accidents over the period of time per month.
VIEWPie chart showcasing the percentage of accidents that took place in various Weather Conditions.
VIEWPercentages of accidents that occured on different surface conditions of the road at the time of accident.
VIEWThe number of accidents that occured on different types of roads.
VIEWHere's our wonderfull team members who did their absolute best to complete this project
Drunk Driving

Do's and Dont's